Private Sub MySQLfunction()
Dim MySQLcon As String
Dim xconn As MySql.Data.MySqlClient.MySqlConnection
'txtuname.text
'txtpass.text
'cbopri.text
'code para sa save button ng createuser form
'i check kung pareho ang password sa retype password
'kung hindi pareho ibalik ang focus sa txtpass.text
'at mag exit sub
'kung pareho ilagay ang code sa baba
If txtpass.Text.Trim <> txtretype.Text.Trim Then
MsgBox("Error: Password did not Match!", vbCritical, "Warning!")
txtretype.Clear()
txtpass.Focus()
txtpass.Select()
Exit Sub
End If
Try
If Not xconn Is Nothing Then xconn.Close()
MySQLcon = String.Format("Server = {0};Database={3}; User ID={1}; Password={2};Port={4};", xServer, xUserID, xPassword, "mysql", xPort)
'or
'MySQLcon = String.Format("Server = {0};Database={3}; User ID={1}; Password={2};Port={4};", xServer, xUserID, xPassword, dbname, xPort)
xconn = New MySqlConnection(MySQLcon)
xconn.Open()
Mysqlcmd(MySQLcon, "DELETE FROM USER WHERE `User` LIKE '" & txtuname.Text & "' AND `Host` LIKE 'localhost'")
Mysqlcmd(MySQLcon, "CREATE USER '" & txtuname.Text & "'@'%' IDENTIFIED BY '***';")
Mysqlcmd(MySQLcon, "SET PASSWORD FOR '" & txtuname.Text & "'@'%' = PASSWORD('" & txtpass.Text & "')")
Mysqlcmd(MySQLcon, "CREATE USER '" & txtuname.Text & "'@'localhost' IDENTIFIED BY '***';")
Mysqlcmd(MySQLcon, "GRANT SELECT, EXECUTE, SHOW VIEW, ALTER, ALTER ROUTINE, CREATE, CREATE ROUTINE, CREATE TEMPORARY TABLES, CREATE VIEW, DELETE, DROP, EVENT, INDEX, INSERT, REFERENCES, TRIGGER, UPDATE, LOCK TABLES ON `" & xDatabase & "`.* TO '" & txtuname.Text & "'@'%' WITH GRANT OPTION")
Mysqlcmd(MySQLcon, "SET PASSWORD FOR '" & txtuname.Text & "'@'localhost' = PASSWORD('" & txtpass.Text & "')")
Mysqlcmd(MySQLcon, "DELETE FROM USER WHERE `User` LIKE '" & txtuname.Text & "' AND `Host` LIKE '%'")
'FOR ADMIN ONLY
Mysqlcmd(MySQLcon, "GRANT ALL PRIVILEGES ON * . * TO '" & txtuname.Text & "'@'%' IDENTIFIED BY '***' WITH GRANT OPTION MAX_QUERIES_PER_HOUR 0 MAX_CONNECTIONS_PER_HOUR 0 MAX_UPDATES_PER_HOUR 0 MAX_USER_CONNECTIONS 0 ;")
'END OF ADMIN ONLY
Catch err As Exception
'MsgBox(err.Message.ToString)
End Try
End Sub
Saturday, October 15, 2011
create user for mysql database using vb.net 2010
VB.Net 2010 and MS Excel 2007 (Code to access Excel File using vb.Net2010)
'Add reference to Microsoft.Office.Interop.Excel
Dim ExcelApp As New Microsoft.Office.Interop.Excel
Dim WSheet As New Microsoft.Office.Interop.Excel
'if the code above does not work then declare Wsheet as
'Dim WSheet As Microsoft.Office.Interop.Excel
Dim ExcelProcess As New Process
Try
WSheet = ExcelApp.Sheets("Sheet1")
Catch ex As Exception
ExcelProcess.Start(Application.StartupPath & "\reports\excelFile.xlsx")
WSheet = ExcelApp.Sheets("Sheet1")
ExcelApp.Visible = True
End Try
WSheet.Select()
MsgBox(WSheet.Range("C6:C6").Value)
Try
ExcelApp.Quit()
Catch ex As Exception
End Try
VB.Net 2010 and Crystal Report for .Net Step by Step Tutorial
Add New Windows Form
Choose Crystal Report
Click Close when Crystal Report Gallery Appears Then, goto- Project- Project Name Properties
 Click on Compile-Advanced Compile Options
Change Target Framework to .Net Framework 4 - click OK Go back to your form-scroll down to Reporting Toolbox- and choose - CrystalReportViewer
 - then define the area for your crystal report viewer-
name the report viewer "crviewer" or any name relevant to your report. goto to solution Explorer-right click App.config-click open
click the image below and zoom-in, then type the highlighted code exactly as seen
paste the code below on your module
Imports CrystalDecisions.CrystalReports.Engine
Imports CrystalDecisions.Shared
Module Module_Name_Here
Friend RptDataset As New DataSet
Friend RptTbl As String
'RptFile will contain the path and the name of the crystal report you design
'Example: Application.Startup & "\reports\rptfile.rpt
Friend RptFile As String
End Module
'end of module
'frmcrypt_report
Private Sub frmcrypt_report_Load(ByVal sender As System.Object, ByVal e As System.EventArgs) Handles MyBase.Load
Dim CryRpt As New CrystalDecisions.CrystalReports.Engine.ReportDocument
CryRpt.Load(RptFile)
'the code below is a must to refresh your dataset
RptDataset.Reset()
'use your preferred code to dynamically query your database. the code is for mysql using
'a function that i created to query my database
da = MySelectRows(Mycon, sqlstring, RptTbl)
da.Fill(RptDataset, RptTbl)
'if you are to connect to a server use the code below to login to your server
'it is a must to login to your server.
CryRpt.DataSourceConnections.Item(0).SetConnection("127.0.0.1", "dbname", True)
CryRpt.DataSourceConnections.Item(0).SetLogon("userid", "password")
'end of login to server code
CryRpt.SetDataSource(RptDataset.Tables(RptTbl))
crviewer.ReportSource = CryRpt
crviewer.Refresh()
End Sub
'Code from the form which will call your crystal report form
RptFile = Application.StartupPath & "\REPORT\rptfile.rpt"
RptTbl = "table_name"
frmcrypt_report.ShowDialog()
Sunday, October 2, 2011
Make a solar cell in your kitchen
from http://scitoys.com/scitoys/scitoys/echem/echem2.html
A solar cell is a device for converting energy from
the sun into electricity. The high-efficiency solar
cells you can buy at Radio Shack and other stores are
made from highly processed silicon, and require huge
factories, high temperatures, vacuum equipment, and
lots of money.
If we are willing to sacrifice efficiency for the ability
to make our own solar cells in the kitchen out of materials
from the neighborhood hardware store, we can demonstrate
a working solar cell in about an hour.
Our solar cell is made from cuprous oxide instead of
silicon. Cuprous oxide is one of the first materials known
to display the photoelectric effect, in which light
causes electricity to flow in a material.
src="http://pagead2.googlesyndication.com/pagead/show_ads.js">
Thinking about how to explain the photoelectric effect is
what led Albert Einstein to the Nobel prize for physics,
and to the theory of relativity.
Materials you will need
The solar cell is made from these materials:
- A sheet of copper flashing from the hardware store.
This normally costs about $5.00 per square foot.
We will need about half a square foot. - Two alligator clip leads.
- A sensitive micro-ammeter that can read currents
between 10 and 50 microamperes. Radio Shack sells
small LCD multimeters that will do, but I used a
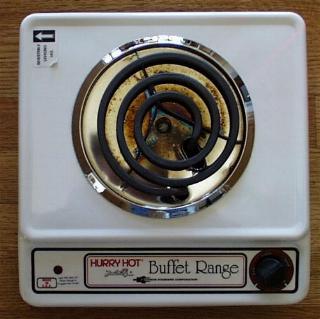
small surplus meter with a needle. - An electric stove. My kitchen stove is gas, so I bought
a small one-burner electric hotplate for about $25. The
little 700 watt burners probably won't work -- mine is
1100 watts, so the burner gets red hot. - A large clear plastic bottle off of which you can cut the top.
I used a 2 liter spring water bottle. A large mouth glass
jar will also work. - Table salt. We will want a couple tablespoons of salt.
- Tap water.
- Sand paper or a wire brush on an electric drill.
- Sheet metal shears for cutting the copper sheet.
How to build the solar cell
My burner looks like this:
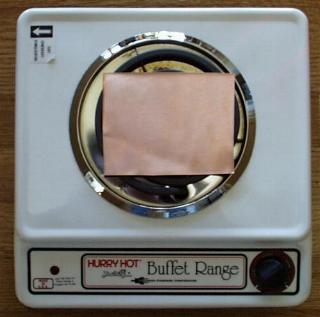
The first step is to cut a piece of the copper sheeting
that is about the size of the burner on the stove. Wash your
hands so they don't have any grease or oil on them. Then
wash the copper sheet with soap or cleanser to get any oil
or grease off of it.
Use the sandpaper or wire brush to thoroughly clean the copper
sheeting, so that any sulphide or other light corrosion is
removed.
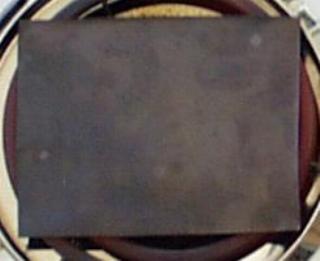
Next, place the cleaned and dried copper sheet on the burner
and turn the burner to its highest setting.
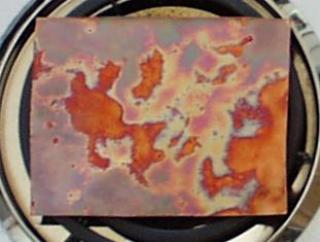
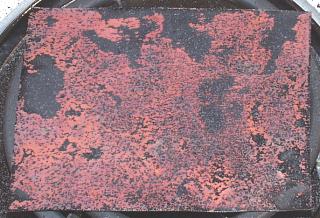
As the copper starts to heat up, you will see beautiful oxidation
patterns begin to form. Oranges, purples, and reds will cover the
copper.
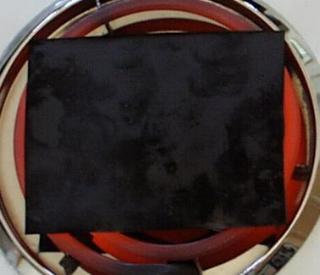
As the copper gets hotter, the colors are replaced with a black
coating of cupric oxide. This is not the oxide
we want, but it will flake off later, showing the reds, oranges,
pinks, and purples of the cuprous oxide layer underneath.
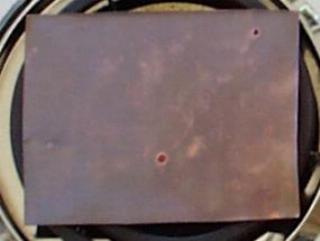
The last bits of color disappear as the burner starts to glow red.
When the burner is glowing red-hot, the sheet of copper will be
coated with a black cupric oxide coat. Let it cook for a half
an hour, so the black coating will be thick. This is important,
since a thick coating will flake off nicely, while a thin coat
will stay stuck to the copper.
After the half hour of cooking, turn off the burner.
Leave the hot copper on the burner to cool slowly.
If you cool it too quickly, the black oxide will stay
stuck to the copper.
As the copper cools, it shrinks.
The black cupric oxide also shrinks.
But they shrink at different rates, which makes
the black cupric oxide flake off.
The little black flakes pop off the copper with
enough force to make them fly a few inches. This
means a little more cleaning effort around the stove,
but it is fun to watch.
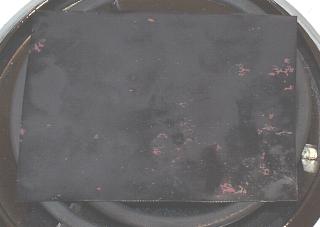
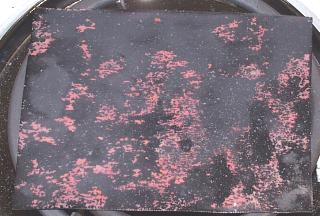
When the copper has cooled to room temperature (this takes about
20 minutes), most of the black oxide will be gone. A light scrubbing
with your hands under running water will remove most of the small
bits. Resist the temptation to remove all of the black spots by
hard scrubbing or by flexing the soft copper. This might damage
the delicate red cuprous oxide layer we need to make to solar cell work.
The rest of the assembly is very simple and quick.
Cut another sheet of copper about the same size as the first one.
Bend both pieces gently, so they will fit into the plastic bottle
or jar without touching one another. The cuprous oxide coating
that was facing up on the burner is usually the best side to face
outwards in the jar, because it has the smoothest, cleanest surface.
Attach the two alligator clip leads, one to the new copper plate,
and one to the cuprous oxide coated plate. Connect the lead from
the clean copper plate to the positive terminal of the meter.
Connect the lead from the cuprous oxide plate to the negative
terminal of the meter.
Now mix a couple tablespoons of salt into some hot tap water.
Stir the saltwater until all the salt is dissolved.
Then carefully pour the saltwater into the jar, being careful not
to get the clip leads wet. The saltwater should not completely
cover the plates -- you should leave about an inch of plate
above the water, so you can move the solar cell around without
getting the clip leads wet.
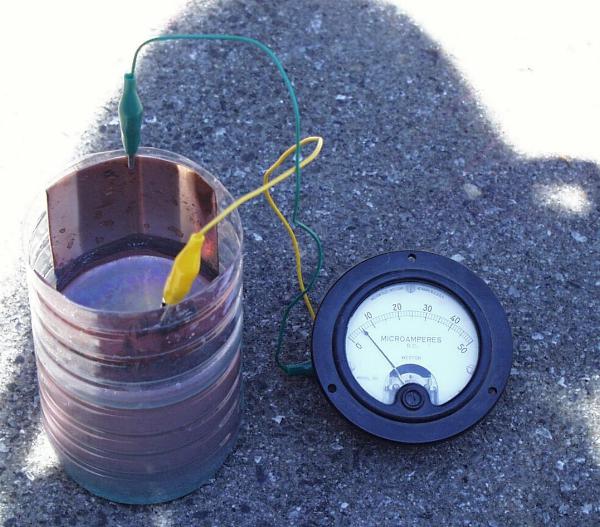
The photo above shows the solar cell in my shadow as I took
the picture. Notice that the meter is reading about 6 microamps
of current.
The solar cell is a battery, even in the dark, and will usually
show a few microamps of current.
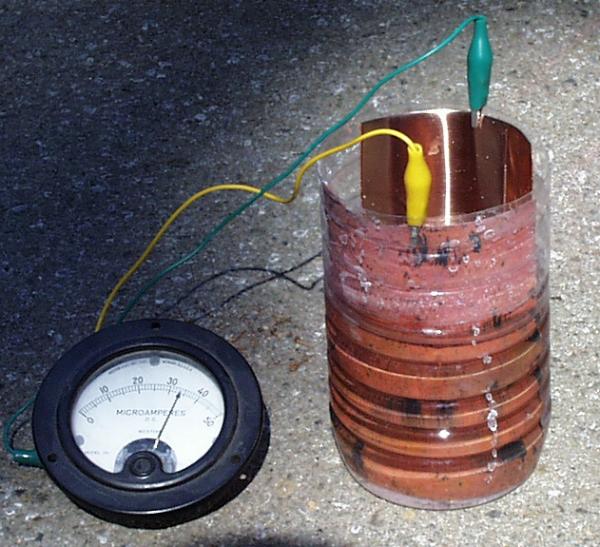
The above photo shows the solar cell in the sunshine.
Notice that the meter has jumped up to about 33 microamps
of current. Sometimes it will go over 50 microamps, swinging
the needle all the way over to the right.
How does it do that?
Cuprous oxide is a type of material called a semiconductor.
A semiconductor is in between a conductor, where electricity can
flow freely, and an insulator, where electrons are bound tightly
to their atoms and do not flow freely.
In a semiconductor, there is a gap, called a bandgap between
the electrons that are bound tightly to the atom, and the electrons
that are farther from the atom, which can move freely and conduct
electricity.
Electrons cannot stay inside the bandgap. An electron cannot gain
just a little bit of energy and move away from the atom's nucleus
into the bandgap. An electron must gain enough energy to move
farther away from the nucleus, outside of the bandgap.
Similarly, an electron outside the bandgap cannot lose a little
bit of energy and fall just a little bit closer to the nucleus.
It must lose enough energy to fall past the bandgap into the
area where electrons are allowed.
When sunlight hits the electrons in the cuprous oxide, some of the
electrons gain enough energy from the sunlight to jump past the bandgap
and become free to conduct electricity.
The free electrons move into the saltwater, then into the clean copper plate,
into the wire, through the meter, and back to the cuprous oxide plate.
As the electrons move through the meter, they perform the work needed to
move the needle. When a shadow falls on the solar cell, fewer electrons
move through the meter, and the needle dips back down.
A note about power
The cell produces 50 microamps at 0.25 volts.
This is 0.0000125 watts (12.5 microwatts).
Don't expect to light light bulbs or charge batteries with
this device. It can be used as a light detector or light meter,
but it would take acres of them to power your house.
The 0.0000125 watts (12.5 microwatts) is for a 0.01 square meter cell,
or 1.25 milliwatts per square meter. To light a 100 watt light bulb, it
would take 80,000 square meters of cuprous oxide for the sunlit side, and
80,000 square meters of copper for the dark electrode. To run a 1,000 watt
stove, you would need 800,000 square meters of cuprous oxide, and another
800,000 square meters of plain copper, or 1,600,000 square meters all together.
If this were to form the roof of a home, each home would be 282 meters
long and 282 meters wide, assuming all they needed electricity for was
one stove.
There are 17,222,256.7 square feet in 1,600,000 square meters.
If copper sheeting costs $5 per square foot, the copper alone would cost
$86,110,283.50 USD. Making it one tenth the thickness can bring this down
to $8,611,028.35. Since you are buying in bulk, you might get it for half that,
or about $4,300,000.00.
If you used silicon solar panels costing $4 per watt, you could run the same
stove for $4,000.00. But the panels would only be about 10 square meters.
Or, for about a dollar, you can build a solar stove out of aluminum foil and cardboard.
For about $20, you can build a very nice polished aluminum parabolic solar cooker.
src="http://pagead2.googlesyndication.com/pagead/show_ads.js">
Tuesday, April 26, 2011
How to Create a Solar Bottle Bulb
How to make your own Solar Bottle Light Bulb?
The materials are the following: 1.5 liter soda bottle, 1’x1’ roof sheet material, purified water, camera film dispenser, chlorine and a rubber sealant.
Procedure:
Step 1. Fill the 1.5 liter clear soda bottle with purified water then add 3 tablespoons of liquid bleach and tightly seal the cap. Do not use tap water because this will allow the growth of moss.
Step 2. Make a hole in the 1’x1’ roof sheet material, just the same size of the bottle’s circumference and insert the bottom part of the bottle leaving it exposed under the sunlight.
Step 3. Next, make another hole on the roof of the house (same as the bottle’s circumference) where you want to put the solar bulb and firmly fix the device.
Step 4. Seal the roof with a sealant to prevent raindrops from getting inside the house. It will produce a light when the water inside the bottle bulb refracts and scatters the light inside the house.
The solar bulb is expected to last up to two years before it needs changing.
Wednesday, April 13, 2011
The Hazards of Nuclear Power
The Hazards of Nuclear Power
Bernard L. Cohen
About 80 percent of the American public believes it is more dangerous to generate electricity from nuclear power than from coal. Scientific studies show, however, than coal is many times more dangerous. Even Henry Kendall, director of the anti-nuclear lobbying group Union of Concerned Scientists, and anti-nuclear activist Ralph Nader, in private, concede this.
The enormous public misunderstanding about nuclear power may be largely attributed to (1) a widespread and exaggerated fear of radiation, (2) a highly distorted picture of reactor accidents (3) grossly unjustified fears about disposal of radioactive waste, and (4) failure to understand and quantify risk.
RADIATION
How Dangerous Is Radiation?
Is being struck by a particle of radiation a terrible tragedy? No. Every person is struck by about a million particles of radiation every minute from natural sources. (The rate varies with geography and other factors.) This rate is hundreds of times greater than our exposure to radiation from the nuclear power industry. So is our average exposure to radiation from medical X-rays.
Although a single particle of radiation can cause cancer, the chance it will do so is only about one in 30 quadrillion. Hence, the million particles that strike us each minute have only one chance in 30 billion of causing a cancer. A human lifespan is about 40 million minutes; thus, all of the natural radiation to which we are exposed has about one chance in 700 of causing a cancer. Since our overall chance of dying from cancer is one in five, only one in 140 of all cancers may be due to natural radiation. The average exposure from a nuclear power plan to those who live closest to it is about 1 percent of the exposure to natural radiation; hence, if they live there for a lifetime, there is perhaps once chance in 70,000 (1/100th the chance from natural radiation and 1/14,000 the chance from all causes) that they will die of cancer as a result of exposure to its radiation.
Scientific Basis for Risk Estimates
How do we know these risks so quantitatively? Several prestigious scientific groups provide frequent summaries and evaluations of available data. In the past few years, the US National Academy of Sciences Committee on Biological Effects of Ionizing Radiation (BEIR) and the United National Scientific Committee on Effects of Atomic Radiation (UNSCEAR) have issued reports assessing the cancer risk from low-level radiation. There should be one extra cancer for every 2.6 million mrem (1 millirem = approximately 5 billion particles of radiation) of exposure to humans, i.e., every mrem of exposure produces a 1-in-2.6-million risk of fatal cancer.
The health effects of high-level radiation are well known and serious. But there is little direct evidence on effects of low-level radiation. The simplest way to make estimates is to derive them from data on high-level radiation by assuming a linear dose-effect relationship. For example, if high-level dose D causes a cancer risk R, we assume that a dose 0.01 D will cause a risk 0.01 R. This assumption is nearly always used, with relatively minor variations. It was used to drive the estimate of one cancer death per 2.6 million mrem given above. However, this is more likely to overestimate than to underestimate the effects of low-level radiation, and the minor variations from linear behavior often used are such as to reduce, moderately, the estimated effects at low levels. This may be described graphically by stating that the curve of cancer risk vs. radiation does is concave upward, i.e., it curves upward at high dose from a simple straight line. There is abundant evidence supporting this viewpoint.
Routine Emissions from the Nuclear Industry
In operation, nuclear power plants routinely release small quantities of radioactive gases and contaminants in water into the environment. More importantly, when reactor fuel is chemically reprocessed, more radioactive gases are released at the reprocessing plant. Extensive studies predict that, with current technology, routine releases of radiation due to operation of one large power plant for one year, including reprocessing, will cause 0.25 cancer deaths over the next 500 years. Since we are not reprocessing fuel now, effects of current operations are only about 20 percent of this. Available technologies can drastically reduce releases from reprocessing plants.
REACTOR ACCIDENTS
Power plants include many levels of protection against radioactivity releases, based on a defense in depth design philosophy. For example, an accident could be initiated by a sudden rupture in the system, allowing the cooling water to escape. Levels of protection against this are:
1. the highest quality standards on materials and equipment in which such a rupture might occur;
2. elaborate inspection programs to detect flaws in the system using X-ray, ultrasonic, and visual techniques;
3. leak-detection systems (Normally a rupture starts out as a small crack, allowing water to leak out slowly. Such leaks would be detected by these systems and repaired before a rupture could occur.);
4. an emergency cooling system, which would rapidly replace the water lost in such a rupture accident, restoring cooling to the reactor fuel. (In this type of accident there are several different pumping systems, any one of which would provide sufficient water to avert a meltdown if all the other somehow failed.);
5. the containment, a strong building in which the reactor is housed, which would normally hold the released radioactivity inside even if there were a meltdown.
Occasionally there is a failure at some power plant in one of these lines of defense, e.g., a valve that should be open is found closed. The media report this as a near miss or a disaster, apparently not understanding defense in depth. While it is possible for each line of defense to fail, one after another, the probability of such a sequence is extremely low. Moreover, the same reasoning applies to almost any other technology. In pumping gasoline, for example, a highly improbable sequence of highly improbably events could burn down a city, killing most of its inhabitants, yet the media do not trumpet warning of these impending catastrophes.
How large is the risk to the public from a reactor accident? The scientific approach to this problem is through Probabilistic Risk Analysis (PRA), which, in principle, considers every combination of events that can lead to health impacts, along with their probability of occurrence. The individual events are failures of valves, pumps, welds, and such, for which there are abundant data on frequency. It is therefore not difficult to determine the probability for any given sequence of events. PRA have completed on about 30 plants and will soon be available for all US plants. We give typical results here. We also give results from a study by the anti-nuclear activist organization, Union of Concerned Scientists.11
For the frequency, the PRA give one meltdown per 10,000 plant-years, whereas the UCS estimate is one per 2,000 plant-years. After about 4,000 plant-years of commercial operation of this type reactor around the world and about 3,000 equivalent plant-years of naval reactor operation, there has been only one fuel damage accident, Three Mile Island.* Thus, the UCS estimate implies that we have been extremely lucky, although these results are not surprising based on PRA.
There is widespread misunderstanding of the consequences of a fuel meltdown. We often hear that it would kill tens of thousands of people and contaminate a whole state, but such statements are grossly misleading. The containment building would ordinarily contain the radioactive dust inside long enough (about a day) to clean it out of the air. For example, investigators of the Three Mile Island accident12 all agree that even if there had been a complete meltdown, there would have been little harm to the public, because there is not reason to believe that the integrity of the containment would have been compromised. In most meltdown, no fatalities are to be expected.
Some events could break open the containment building, releasing radioactive dust into the environment. If this happens, the consequences depend on timing and weather. In the most unfavorable condition, with a large containment break early in the accident, PRA estimates 50,000 fatalities in some cases, but this unusual combination is expected only once in 100,000 meltdowns, i.e., about once in a billion plant years.
According to PRA, the average number of fatalities to be expected in a reactor meltdown is 400; according to UCS, it is 5,000. Estimates of the fatality rate due to air pollution from coal burning are at least 10,000 each year.13 For reactor meltdown to be as harmful as coal-burning, we would therefore need a meltdown every two weeks according to the PRA, or every six months according to UCS. No one has suggested that meltdowns will occur anywhere near that frequently.
When the frequency and consequence estimates are combined, the Nuclear Regulatory Commission concludes that we may expect an average of 0.02 fatalities per plant-year; UCS predicts 2.4. Even the latter figure is less than one-tenth the 25 fatalities per plant-year due to air pollution from coal-burning electricity generation.13 Of course these fatalities from air pollution are not detectable in the US population, in which two million people die every year. But the same would be true of 98 percent of the predicted fatalities from reactor meltdown accidents. For example, the worst such accident normally considered would cause 45,000 extra cancer deaths in a population of ten million over 50 years. For each of these ten million, the risk of dying from cancer would rise by only 2.5 percent, which would hardly be detectable. The present risk in different states varies between 16 percent and 24 percent, so the added cancer risk in moving from one state to another is often many times larger than the added risk from such a nuclear accident.
Detectable fatalities -- occurring shortly after the hypothetical accident and clearly attributable to it - would be rather rare. According to PRA, 98 percent of all meltdowns would cause no detectable fatalities, the average number for all meltdowns is ten, and the worst meltdown in the analyses (1 1-in-100,000 occurrence) would cause 3,500. The largest coal-related incident to date was an air pollution episode in London in 1952 that cased 3,500 fatalities within a few days.13 Thus, as far as detectable fatalities are concerned, the worst nuclear accident in 100,000 meltdowns has already been equaled by coal burning.
The extent of land contamination in a reactor meltdown accident depends on one's definition of contamination. The whole earth can be said to be contaminated because there is natural radioactivity everywhere. But if we use the internationally accepted definition of the level that calls for remedial action, the worst meltdown normally considered (one in 10,000) would contaminate an area equal to a circle 60 miles in diameter. About 90 percent of this could be easily decontaminated by use of fire hoses and plowing open fields, so the area where relation of people is necessary would be equal to that of a circle 20 miles across. Forced relocation of people is not catastrophic. It occurs when new dams permanently flood large areas, in highway construction, in urban redevelopment, etc. In such situations the major consideration is the cost of relocating people. Therefore, it seems reasonable to consider land contamination by a nuclear accident on the basis of its monetary cost.
In the worst 0.01 percent of accidents, the cost could exceed $30 billion, but the average cost for all meltdowns would be $200 million. Air pollution from coal burning also does property damage, estimated in the range of $1 billion per year.14 At an average of $200 million per meltdown, it would take a reactor meltdown every two months to be as costly as the property damage from coal burning.
RADIOACTIVE WASTE
There are several types of radioactive waste generated by the nuclear industry, but we will concentrate largely on the two most important and potentially dangerous, high-level waste and radon.
High-Level Waste 15
In a rationally planned and developed nuclear power program, spent reactor fuel would be shipped to a reprocessing plant to remove valuable components. The residue, containing nearly all of the radioactivity produced in the reactor, is called high-level waste. (In the US program, where spent fuel is simply potted and encased, reprocessing is not currently done or even planned, but it is done in other countries.) Following reprocessing, the waste can be converted into a rock-like form and buried deep underground in a carefully selected geological formation.
One important aspect of high-level waste disposal is the small quantities involved. The waste generated by one large nuclear power plant in one year and prepared for burial is about six cubic yards, roughly one truckload. This is two million times smaller by weight, and billion of times smaller by volume, than wastes from a coal plant. The electricity generated in a year sells for more than $400 million, so if only 1 percent of the sales price were diverted to waste disposal, $4 million might be spent to bury this one truckload of waste, enough to pay for very elaborate protective measures.
To understand the very long-term (millions of years) hazard, natural radioactivity in the ground is a good comparison. The ground is full of naturally radioactive materials. By adding nuclear waste to it, the totally radioactivity in the top 2,000 feet of US soil would increase by one part in ten million per plant-year. Moreover, the radioactivity in the ground (except perhaps very near the surface) does virtually no harm.
The principal concern about buried waste is that it might dissolve in groundwater and contaminate food and drinking water supplies. How dangerous is this material to eat or drink? When first buried, it is highly toxic, and a fatal dose (yielding a 50 percent chance of death) is only 0.01 ounce. However, after 100 years the fatal dose is 0.1 ounce, and after 600 years it is one ounce, making it no more toxic than many common household chemicals and medicines. After 10,000 years a lethal dose is ten ounces.
Some people are frightened on hearing that nuclear waste must be isolated for a few hundred years. But 2,000 feet below earth's surface, things remain essentially unchanged for millions of years. Waste burial plans include measures to delay the release of the waste to the environment for a very long time, yielding near-perfect protection from the short-term (several hundred or thousand years) problem. First, wastes will be buried in rock formations isolated from groundwater and expected to remain so for at least 1,000 years. Second, if water did enter, it would be no more likely to dissolve the waste than the surrounding rock; for the latter the time required is ordinarily millions of years. Third, clay backfill materials surrounding the waste package swell up to seal very tightly when wet, keeping out any appreciable amount of water. Fourth, if groundwater did reach and dissolve some of the waste, these clays would effectively filter radioactive material out of solution before it could escape with the water. Also, waste will be sealed in corrosion-resistant casings that would not dissolve even if soaked in groundwater for many thousands of years. Finally, if radioactivity did reach surface waters, it would be detected easily -- a millionth of the amounts that can be very harmful are readily detected -- and measure could be taken to prevent it from getting into drinking water or food.
With all these safeguards it seems almost impossible for much harm to result during the first few hundred years, while the waste is highly toxic and there is substantial protection over the long term.
It can be helpful to compare radioactive waste with ordinary rock. An average atom of rock has about one chance in a billion per year of escaping into surface waters and one in a thousand of getting into a human body afterward. If these probabilities are combined and applied to buried radioactive waste, the result indicates that the waste would eventually cause 0.02 fatalities per plant-year -- a thousand times less than the health effects of air pollution from coal burning.
Rational risk assessment considers alternatives. Nuclear wastes remain radioactive for thousands or even millions of years, but some cancer-causing solid wastes released in coal-burning -- like arsenic, beryllium, cadmium, chromium, and nickel -- last forever. They can be expected to cause about 70 eventual fatalities per plant-year, thousands of times more than nuclear waste. Also, solar electricity technologies require vast amounts of materials, and deriving these requires burning large quantities of coal. The waste from solar technologies are many times more harmful than nuclear wastes. In addition, some solar technologies use large quantities of cadmium, which increases the health consequences considerably.15
Radon Problems 16
Another aspect of nuclear waste may involve important health impacts: the release of radon, a radioactive gas that naturally evolves from uranium. There has been some concern over increased releases of radon due to uranium mining and milling operations. These problems have now been substantially reduced by cleaning up those operations and covering the residues with several feet of soil. The health effects of this radon are several times larger than those from other nuclear wastes, such as the high-level waste discussed above, but they are still much smaller than the effects of coal-burning.
However, a far more important impact of the nuclear industry on radon is that by mining uranium out of the ground, we avert future radon emissions and thus avoid future health impacts. Most of the uranium is mined from deep underground, so one might think the radon could not escape. However, the ground surface is constantly eroding away, so eventually the uranium mined would have been near the surface, where it radon emissions could cause lung cancers. When these effects are calculated, the result is an eventual saving of 450 lives per plant-year operation. This saving is thousands of times larger than the lives calculated to be lost from radioactive waste. Also, coal burning releases small amounts of uranium into the environment, eventually causing 30 fatalities per plant-year through radon released.
Summary on Waste
The number of deaths per plant-year estimated in the preceding discussion (plus a few others) is summarized in Table 1. Since many people (including myself) feel that it is meaningless to consider effects over many millions of years, a column has also been included summarizing effects realized over the next 500 years. It should be understood that the minus signs on the numbers for radon from nuclear power indicate lives saved rather than lost. Note that there are three types of waste from coal burning, each of which is thousands of times more harmful than the nuclear waste.
Table 1: Deaths per 1,000 MW plant per year of operation due to wastes Source Next 500 years Millions of years
Nuclear:
-- high-level waste 0.0001 0.02
-- radon emissions -0.0650 -450
-- low-level waste 0.0001 0.0004
-- total -0.0648 -450
Coal:
-- air pollution 25 25
-- radon emissions 0.11 30
-- cancer-causing chemicals 0.5 70
-- total 25.61 125
Solar photovoltaics:
-- coal for materials 0.8 3.7
-- cadmium sulfide (if used) 0.8 80
-- total 1.6 83.7
RISKS IN PERSPECTIVE
Risks are commonly stated in terms of probabilities of death at various ages, but to make them more understandable we express them as loss of life expectancy (LLE) (see Figure 1 below). (An LLE of one day does not mean that each person will die one day sooner but that the average shortening of each life is one day -- true if one person in a thousand dies 1,000 days earlier while 999 are unaffected.) The LLE for nuclear power is about one hour (0.04 day) according to most scientific estimates, or 1.5 days according to the Union of Concerned Scientists. The LLE for coal-burning pollution is about 13 days, from oil burning about 4.5 days, and from natural gas about 2.5 days. This makes the LLE from nuclear generation from 8 to 300 times less than from coal, 3 to 100 times less than from oil, and 1.7 to 60 times less than from natural gas. To put these numbers in perspective, we show in Figure 1 the LLE from some other common risks we face.17 Notice that even energy conservation bears risks: radon trapped by tighter housing construction; smaller, riskier cars; more crimes and accidents in reduced lighting; etc. Any one of these items makes energy conservation much more risky than nuclear power.
Figure 1: Comparison of risks. Length of bar is LLE. Asterisk denotes average risk over the total US population; others refer to risks of those exposed or participating. The ordinate scale is shown at top. The length of the bars are multiplied by 20 in the center scetion and by 1,000 in the bottom section. The first bar in each section reproduces the last bar in the previous section, showing the effect of the scale change.
Far more important is the danger that over-zealous conservation may reduce our wealth. In the United States, well-to-do people live ten years longer than poor people. Producing wealth requires a lot of energy. Therefore, it conserving energy reduces wealth, the ultimate health risks from conservation would dwarf the few hours LLE from nuclear power.
Another way to put the risks of nuclear energy into perspective is to show what other risks they are equivalent to. To make this non-controversial, we use both the PRA and UCS estimates for risks of nuclear power, the latter in parentheses. The risks from having all electricity in the United States generated by nuclear power are equivalent to the following risks:
1. a regular smoker smoking one extra cigarette every 15 years (3 months);
2. an overweight person increasing his weight by 0.012 ounce (0.8 ounce);
3. raising the highway speed limit from 55 to 55.006 (55.6) miles per hour.
WHY THE PUBLIC MISUNDERSTANDING?
Why are the risks of nuclear power so grossly exaggerated in the public mind? The public gets most of its information from the news media, so the media are responsible. Stories about dangers of radiation are exciting and therefore get wide coverage. Yet there has not been a single fatal accident in the United States involving radiation for 25 years, during which there have been three million fatalities from other accidents. Members of the media generally do not read the scientific literature. The contact with science if often through a few publicity-seeking scientists who tell them what they want to hear. Any scientist who reports the slightest evidence that makes radiation seem dangerous gets tremendous coverage, while contrary evidence is generally ignored.
As a consequence, all new power plants ordered for the past several years been coal burners. Yet every time a coal-burning plant is built instead of a nuclear plant, many hundreds of people are condemned to premature death.
NOTES
1. This chapter is based on B.L. Cohen, The Nuclear Energy Option. New York: Plenum, 1990.
2. Opinion Research Corp. "Public Attitudes Towards Nuclear Power vs. Other Energy Sources," ORC Public Opinion Index, 38, 17 (September 1980).
3. National Academy of Sciences Committee on Nuclear and Alternative Energy Systems, Energy in Transition, 1985-2010. San Francisco: W.H. Freeman, 1980; American Medical Association Council on Scientific Affairs, "Health evaluation of energy generating sources." Journal of the American Medical Association, 240 (1978), 2193; Nuclear Energy Policy Study Group, Nuclear Power -- Issues and Choices. Cambridge, MA: Ballinger, 1977; Union of Concerned Scientists, The Risks of Nuclear Power Reactors; United Kingdom Health and Safety Executive, Comparative Risks of Electricity Production Systems (1980). Norwegian Ministry of Oil and Energy, Nuclear Power and Safety (1978); Science Advisory Office, State of Maryland, Coal and Nuclear Power (1980); Legislative Office of Science Advisor, State of Michigan, Coal and Nuclear Power (1980); H. Fisher, et al., "Comparative Effects of Different Energy Technologies," Brookhaven National Laboratory Report BNL 51491 (1981); American Medical Association Council on Scientific Affairs, "Medical Perspective on Nuclear Power" (1989).
4. H. Kendall, Physics Colloquium, at Carnegie-Mellon University (1980).
5. In answer to my question, Nader replied, "Maybe we can clean up coal, or maybe we shouldn't burn coal either."
6. National Academy of Sciences Committee on Biological Effects of Ionizing Radiation (BEIR-V), Health Effects of Exposure to Low Levels of Ionizing Radiation. Washington: 1990. A large number of references if given.
7. United Nations Scientific Committee on Effects of Atomic Radiation (UN-SCEAR), Sources, Effects and Risks of Ionizing Radiation. New York: United Nationals, 1988. A large number of references is given.
8. B.L. Cohen. "The Cancer Risk from Low Level Radiation." Health Physics, 39 (1980), 659. Many references are given. (A few papers have purported to give evidence that the cancer risk vs. dose curve is concave downward, which would indicate that the linear assumption underestimates the risk of low-level radiation. Each of these, however, has been severely criticized in the scientific literature and has been rejected by all groups charged with responsibilities in radiation protection.)
9. Many people think that a nuclear reactor can explode like an atomic bomb, but technical arguments easily prove that his is absolutely impossible.
10. Reactor Safety Study, Nuclear Regulatory Commission Document WASH-1400, NUREG 75/014 (1975); "Severe Accident Risks: An Assessment for Five U.S. Nuclear Power Plants," Nuclear Regulatory Commission Document RUEG-1150 (1989).
11. Union of Concerned Scientists. The Risks of Nuclear Power Reactors (Cambridge, MA: 1977). They give 2.4 deaths/GWe-year, which, multiplied by 100 GWe, the total amount generated in the USA, gives 240 deaths/year. While this study is rather old, no new information has developed in recent years that would increase risk estimates.
12. Report of the President's Commission on the Accident at Three Mile Island, J.B. Kemeny, chairman. Washington: October 1979; Three Mile Island, A Report to the Commissioners and to the Public, M. Rogovin, director. Washington: January 1980.
13. R. Wilson, S.D. Colome, J.D. Spengler, and D.G. Wilson, Health Effect of Fossil Fuel Burning. Cambridge, MA: Ballinger, 1980; H. Ozkaynak, and J.C. Spengler, "Analyses of Health Effects Resulting from Population Exposure to Acid Precipitation," Environmental Health Perspectives, 63 (1985), 45.
14. W. Ramsay, The Unpaid Costs of Electrical Energy. Baltimore: Johns Hopkins University Press, 1979.
15. This discussion is based on a group of papers reviewed in B.L. Cohen, "Risk Analysis of Buried Waste from Electricity Generation." American Journal of Physics, 54 (1986), 38.
16. B.L. Cohen, "The Role of Radon in Comparisons of Environmental Effects of Nuclear Energy, Coal Burning, and Phosphate Mining." Health Physics, 40 (1981), 19; "Health Effects of Radon from Coal Burning." Health Physics, 42 (1982), 725.
17. B.L. Cohen, "Catalog of Risks Extended and Updated." Health Physics, 61 (1991), 317.
Reproduced with permission from The State of Humanity, Julian L. Simon, E. Clavin Beisner, and John Phelps, eds., 1995. Bernard L. Cohen has authored six books and over 300 papers in scientific journals, and he was awarded the Health Physics Society Distinguished Scientific Achievement Award.
